An airline earnings range can move before a single extra passenger books. Change the assumed fuel bill and the same flying programme produces a different profit estimate. The arithmetic is straightforward; deciding which price, volume and revenue assumptions belong in it takes more care.
The latest autumn disclosures from Delta Air Lines (NYSE: DAL), United Airlines Holdings (Nasdaq: UAL) and American Airlines Group (Nasdaq: AAL) show why a forecast needs its inputs alongside its headline. Their fourth-quarter fuel assumptions are management estimates, prepared on particular dates and using company-specific definitions. They are not directly comparable measures of purchasing skill.
Fact: three disclosures, three starting points
In its September-quarter results, Delta said its December-quarter earnings outlook used a projected all-in fuel price of approximately $4.25 per gallon. That assumed the forward curve on 2 October and a refinery benefit of about $0.40 per gallon. Its reported September-quarter average was $3.80, while its adjusted average was $3.61. The reconciliation from reported to adjusted fuel expense identifies mark-to-market adjustments and settlements on hedges. Separately, Delta reports a 13-cent-per-gallon refinery benefit for the September quarter; that benefit does not explain the reported-to-adjusted reconciliation. Those definitions matter before any comparison with another carrier.
United’s 20 October investor update put its estimated fourth-quarter average aircraft fuel price at approximately $4.80 per gallon. It paired that assumption with adjusted diluted earnings guidance of $0.50–$1.50 per share. Both are forward-looking inputs and outputs; neither records the quarter’s eventual result.
American’s third-quarter release assumed approximately $4.70 per gallon for the fourth quarter, based on the forward fuel curve on 19 October. It expected roughly $2.8 billion more fuel expense than a year earlier at that price. A forward curve describes market prices for future delivery at a particular observation time; it does not settle what the airline will ultimately pay.
Interpretation: read the bridge before comparing the answers
Which input is doing the work? Start with the forecast period and the fuel measure. A quarterly average needs the prices and quantities expected across the quarter. Today’s spot quotation, an annual crude-oil assumption and a delivered jet-fuel estimate answer different questions. Taxes, delivery costs, refinery effects and the mix of airports can complicate a comparison.
Then inspect volume. A lower price per gallon can accompany a higher total bill if the airline operates more flights. Conversely, cutting flights may reduce fuel consumption while removing ticket revenue and leaving some staffing, leasing and airport costs in place. A smaller fuel expense does not establish that the business became more profitable.
This is also why taking the difference between two airlines’ published assumptions and multiplying it by one airline’s fuel use would be a poor shortcut. First reconcile dates, scope and accounting. Without that work, an exact-looking result would combine inputs that were never intended to fit together.
A sensitivity calculation with all the assumptions visible
Consider a deliberately fictional airline that expects to consume one billion gallons during a quarter. Assume an extra $0.10 per gallon across that entire volume, with no hedging, refinery offset, change in flying or change in fares. The direct increase in fuel expense is $100 million: one billion multiplied by ten cents. This is a hypothetical pre-tax cost calculation, not an estimate for any of the three companies.
Hypothetical · pre-tax expense
Ten cents across a billion gallons
Additional quarterly fuel expense
1bn gallons × $0.10; all other inputs fixed
If only half that consumption occurs after the price increase, the direct extra expense becomes $50 million under the same assumptions. The timing changes the answer even though the headline price move stays the same. An analyst should state whether a sensitivity applies to the full period, the remaining period or an annualised run rate.
Moving from that expense to earnings per share requires more inputs: taxes, the relevant share count and any offsetting business changes. Dividing $100 million by an arbitrary share count would add apparent precision while concealing those dependencies. Keep the first calculation at the level its assumptions support.
Who could benefit?
Conditional interpretation: Delta, United and American could each retain more operating profit over a coming quarter if delivered fuel costs fall below their own forecast assumptions while passenger revenue, consumption and other costs hold up. Fuel is a direct operating expense for all three. The opportunity is therefore a lower bill relative to the carrier’s own baseline, rather than a ranking based on the lowest published number.
For Delta, the disclosed refinery effects make it particularly important to compare like definitions. For United, a revised fuel assumption should be read alongside the earnings range in the same dated update. For American, the stated year-on-year expense increase shows that the assumption is material to the quarter. These are business mechanisms, not predictions of share-price gains.
Who’s at risk?
Conditional interpretation: The same three issuers face the reverse exposure if fuel costs exceed their assumptions and fares or other revenue do not compensate. American’s projected $2.8 billion increase is a comparison with the previous year’s quarter, not a sensitivity to an additional ten-cent price move. Treating it as the latter would misstate the disclosure.
Over the next quarter, the useful evidence is actual fuel price and consumption alongside revenue and operating expense. Over a longer horizon, changes to aircraft efficiency, networks and purchasing arrangements can alter exposure. A simple fixed-volume sensitivity cannot quantify those responses. Nor does a stronger revenue figure alone establish that higher fuel costs have been recovered profitably.
Speculation: the next fuel price remains an open input
This article makes no forecast of fuel prices or of which airline will outperform. Lower fuel prices might arrive alongside weaker travel demand; higher prices might coincide with stronger fares. Those are possible scenarios, with no probabilities assigned here. A one-variable worked example helps identify a dependency, but it cannot describe every combination of business conditions.
The assessment would change with a new dated company outlook, a different consumption plan or actual quarterly results that show how costs and revenue moved together. Read the forecast as a conditional calculation. Preserve the date, definition and denominator before deciding what its earnings range tells you.
Sources checked 30 October 2026. This article explains company disclosures and hypothetical arithmetic for general information; it provides no investment recommendation.
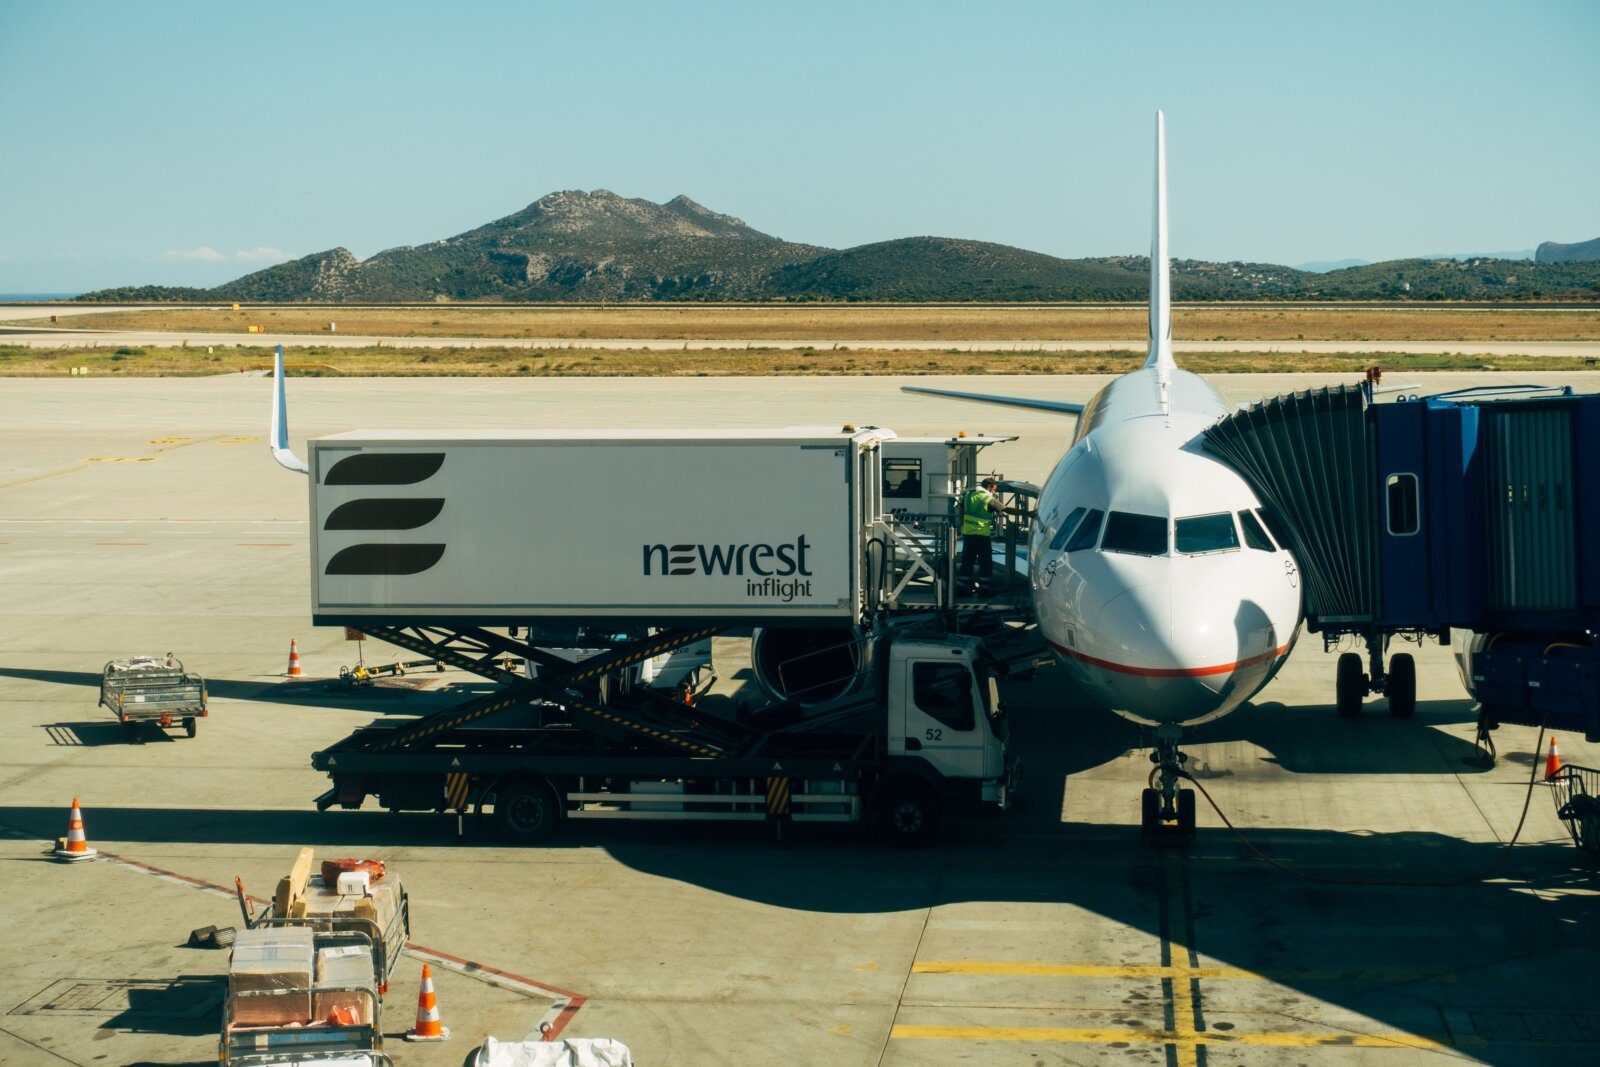
Photo by Markus Winkler on Pexels. Aircraft and ground-service equipment.