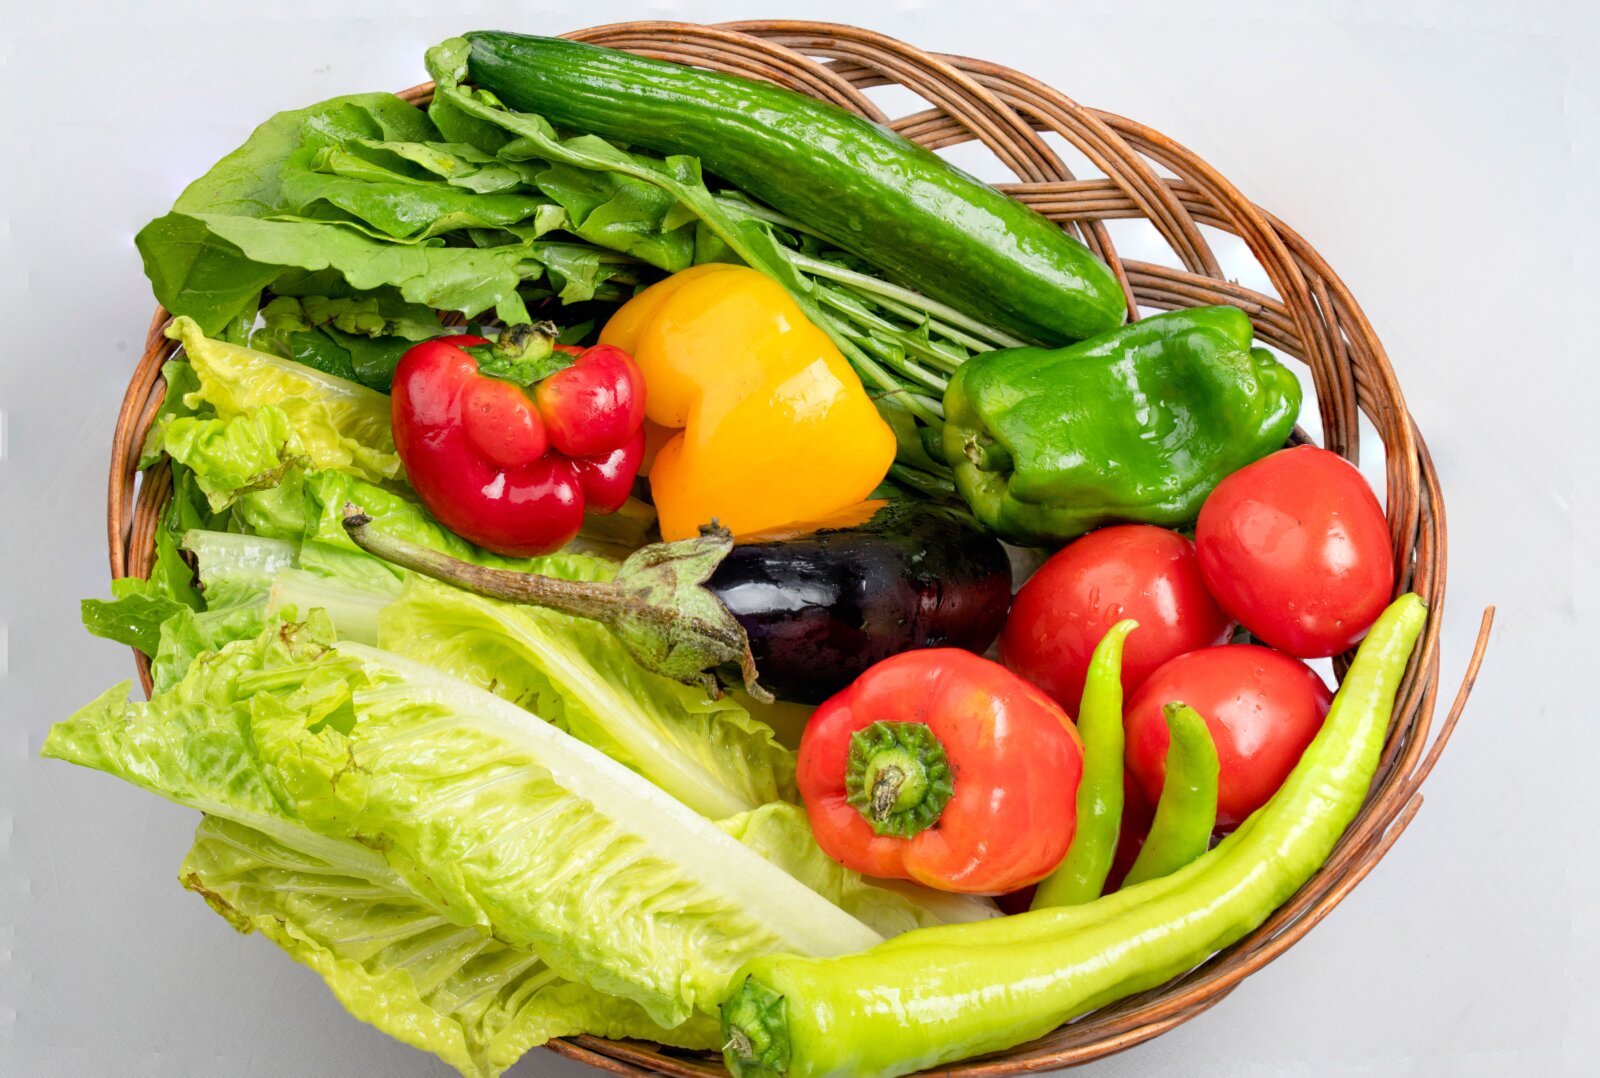
Photo by mohamed abdelghaffar on Pexels. Basket of fresh vegetables.
A £10 basket becomes £11 after a 10% price rise. In the following year, its price rises by 2%. It now costs £11.22. Inflation has slowed sharply in this hypothetical example, yet the basket is 22p dearer than last year and £1.22 dearer than at the starting point.
Hypothetical example
Basket price
Starting price
Before rises
Year one
10% rise
Year two
2% rise
That difference is the useful bit. A falling inflation rate describes a slower increase in prices when the rate remains positive. It doesn’t promise a return to the old bill.
The distinction will matter when the Office for National Statistics (ONS) publishes its next UK consumer-price release. Its calendar lists 21 October 2026, covering September. As checked on 12 October, that release is still unpublished. This is a guide to reading it, not a prediction of its result.
Fact: the latest reading went up
The latest published figures do not show falling headline inflation. In the ONS August bulletin, released on 16 September, the Consumer Prices Index (CPI) rose by 3.1% over twelve months, against 2.9% in July. CPI also increased by 0.5% between July and August.
Those numbers answer different comparisons. The annual rate compares August 2026 with August 2025. The monthly rate compares August 2026 with July 2026. Neither says that every item rose by the same proportion.
The annual rate increased by 0.2 percentage points. Calling that a “0.2% rise in inflation” would leave the unit unclear. Percentage points measure the difference between two percentage rates; a relative percentage change would divide that difference by the original rate.
The bulletin also reports CPIH, the Consumer Prices Index including owner occupiers’ housing costs, at 3.3% annually. That is a different measure, with additional housing coverage. Comparing a CPI figure in one month with CPIH in another would mix definitions as well as dates.
A rate is not a price tag
The Bank of England’s inflation explainer describes inflation as the average change in prices over time and identifies CPI as the measure it targets. Its target is 2%. A positive target still allows the average price level to rise.
In our invented basket, the first year’s increase is £1. The second year’s increase is 22p, because 2% is applied to £11. Applying it to the original £10 would miss the new baseline.
Across the two years, the increase is 12.2%, calculated as £11.22 divided by £10, minus one. Adding 10% and 2% gives 12%, which is close here but doesn’t capture compounding. The second increase starts from a higher price.
Now make the second year’s inflation rate zero. The basket stays at £11. It doesn’t drop to £10. A return from £11 to £10 would require a price fall of about 9.1%, because the £1 reduction is measured against £11.
These are receipt-sized examples, not estimates of an actual UK shopping bill. They show why the rate, the price level and the starting date belong together.
The year-ago comparison moves too
An annual inflation rate has two ends: today’s price index and its value twelve months earlier. When the month changes, both ends can move. A large increase last year can therefore affect the new annual comparison even when prices have not fallen this month.
The ONS calls the influence of that earlier comparison period a base effect. Its 2021 explanation discusses the unusual pandemic comparisons. That historical article explains the mechanism; it is not evidence about September 2026.
Here is a separate hypothetical example using index points, which express relative price levels rather than pounds. Suppose the index was 100 last August and 102 last September. This August it is 105, and this September it remains 105.
Annual inflation in August is 5%: 105 divided by 100, minus one. In September it is about 2.94%: 105 divided by 102, minus one. The annual rate has fallen even though the latest index hasn’t changed.
If this September’s index instead rises to 105.5, annual inflation is about 3.43%. That is still below August’s 5%, despite a monthly price increase of roughly 0.48%.
The arithmetic doesn’t identify the cause of any actual release. It shows why a lower annual number, on its own, cannot establish that prices fell during the latest month.
One national basket, many household bills
A national inflation measure combines categories of spending. It cannot reproduce every household’s particular mix of rent, transport, groceries and other purchases.
The ONS personal-inflation calculator explanation makes this distinction explicit: spending patterns affect the rate a household experiences. It also says the calculator cannot predict future prices or capture every change in shopping habits and product choices.
Consider another invented example. One household spends £50 of a £100 basket on a category whose prices rise 10%, and £50 on items whose prices stay unchanged. Keeping quantities fixed, its basket becomes £105: a 5% increase.
A second household puts only £10 of the same £100 starting basket into the rising category. Its basket becomes £101: a 1% increase. Both calculations can be right. The spending proportions differ.
Actual consumer-price indices use more detailed methods than these two-category sums. And a household’s expenditure can change because it buys different quantities, switches products or faces a changed contract. A bigger total bill is not automatically a pure measure of inflation.
Interpretation: “easing” needs a comparison
Our interpretation is that an inflation headline becomes useful when it identifies what is easing. A slower annual increase can describe less additional pressure than before. It doesn’t, by itself, establish restored purchasing power or cheaper essentials.
A cumulative price rise can remain substantial after the current rate moderates. Equally, some categories can become cheaper while the overall index increases. The aggregate and an individual price tag describe different scales.
That is why the next release deserves more than a glance at the headline rate. The annual and monthly comparisons, the named index and the categories contributing to the movement each add information. An explanation that omits them can make an accurate headline sound more reassuring, or more alarming, than its evidence supports.
This is a reading method, not a conclusion about whether the coming release will be good news.
Who could benefit?
Fact. Tesco (LSE: TSCO) says its 2026/27 interim performance balanced investment in the customer offer and operating cost inflation with savings and an improved sales mix. J Sainsbury (LSE: SBRY) reports food-volume growth alongside significant cost inflation in its 2026 annual report. Both sell the everyday purchases that make the difference between a rate and a receipt tangible.
Interpretation. If household incomes rise faster than the prices of those purchases, shoppers could regain room to buy more. Tesco and Sainsbury’s could benefit through volumes over subsequent months and quarters. That requires an improvement in purchasing power, rather than a lower inflation rate alone. Competitive prices, purchasing costs and wages determine how much additional business reaches profit. Grocery retail is central to both businesses, but this article estimates no incremental earnings.
Fact. Unilever (LSE: ULVR) separates underlying sales growth into price and volume in its half-year 2026 results. Its volume measure also includes product mix. Interpretation. Less pressure on household budgets could support demand for its consumer brands, provided shoppers choose them and the cost of supplying them is controlled. Its international business means one UK CPI release cannot establish a group-wide benefit.
Who’s at risk?
Interpretation. The same retailers face the other side of the receipt: prices can rise more slowly while wages and other operating costs continue increasing. If Tesco or Sainsbury’s cannot offset those costs through efficiency, buying terms or sales volumes, margins could face pressure. Their cited reports describe cost inflation; a fall in headline CPI would not prove that these company costs had fallen.
Fact. In its first-half explanation, Unilever links some pricing decisions to commodity costs and competitive price gaps. Interpretation. Holding prices down to defend demand can leave less room to absorb higher input costs. Raising them can test customers’ willingness to pay. The outcome depends on category, country, mix and timing; UK household inflation and Unilever’s selling-price measure are different units of analysis.
Speculation. September’s annual inflation rate could fall while purchasing power remains squeezed and these firms’ costs keep rising. That scenario carries no assigned probability. Over the next few reporting periods, volumes, selling-price changes, wages, input costs and margins would test the business links. These are conditional operating exposures, not forecasts of share prices or a ranking of investments.
Speculation: September’s result remains open
September’s annual rate could rise, fall or stay unchanged. No outcome is assumed here. If it falls, a claim that prices became cheaper would still need evidence from the relevant price index and comparison period.
A monthly decline would support a narrower statement: the measured average price level fell between those two months. It would not necessarily show a return to prices from several years earlier, or a fall in every household’s costs.
The limitation is deliberate. This article explains definitions and checks illustrative calculations; it doesn’t model inflation, forecast interest rates or assess a financial product. Figures should be refreshed if the publication date moves beyond the next release.
When the new bulletin arrives, the evidence that changes the assessment will be the actual index movement, its period and its underlying categories. Until then, a lower rate remains a possible result, not a reported fact. A clear headline keeps the price level beside the rate.
Informational explanation, not investment advice.